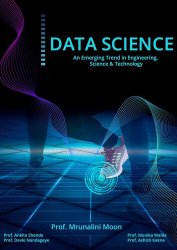
Data Science: An Emerging Trend in Engineering, Science & Technology
- Добавил: literator
- Дата: 23-09-2024, 15:59
- Комментариев: 0
 Название: Data Science: An Emerging Trend in Engineering, Science & Technology
Автор: Mrunalini Moon, Ankita Shende, Monika Walde, Devki Nandgaye
Издательство: Independently published
Год: 2024
Страниц: 432
Язык: английский
Формат: epub
Размер: 36.3 MB
Data Science is a deep study of the massive amount of data, which involves extracting meaningful insights from raw, structured, and unstructured data that is processed using the scientific method, different technologies, and algorithms. It is a multidisciplinary field that uses tools and techniques to manipulate the data so that you can find something new and meaningful.
Here are some of the technical concepts you should know about before starting to learn what is Data Science:
1. Machine Learning
Machine learning is the backbone of Data Science. Data Scientists need to have a solid grasp of ML in addition to basic knowledge of statistics.
2. Modeling
Mathematical models enable you to make quick calculations and predictions based on what you already know about the data. Modeling is also a part of Machine Learning and involves identifying which algorithm is the most suitable to solve a given problem and how to train these models.
3. Statistics
Statistics are at the core of Data Science. A sturdy handle on statistics can help you extract more intelligence and obtain more meaningful results.
4. Programming
Some level of programming is required to execute a successful data science project. The most common programming languages are Python, and R. Python is especially popular because it’s easy to learn, and it supports multiple libraries for data science and ML.
5. Databases
A capable data scientist needs to understand how databases work, how to manage them, and how to extract data from them.
Tools:
Business intelligence tools include MS Excel, Power BI, SAS BI, Micro Strategy, IBM Cognos, Throughput, and more.
Some of the most popular Data science tools are Python, Hadoop, Spark, R, Tensor Flow, BigML, MATLAB, Excel, and more.
NumPy stands for Numerical Python. It is a Python library used for working with an array. In Python, we use the list for purpose of the array but it’s slow to process. NumPy array is a powerful N-dimensional array object and its use in linear algebra, Fourier transform, and random number capabilities. It provides an array object much faster than traditional Python lists. Numpy has fast built-in aggregate and statistical for working on arrays. By using these function or if we have good knowledge of these functions than we will play with arrays.
NumPy is a Python package which means ‘Numerical Python’. It is the library for logical computing, which contains a powerful n-dimensional array object, gives tools to integrate C, C++ and so on. It is likewise helpful in linear based math, arbitrary number capacity and so on. NumPy exhibits can likewise be utilized as an effective multi-dimensional compartment for generic data. NumPy Array: Numpy array is a powerful N-dimensional array object which is in the form of rows and columns. We can initialize NumPy arrays from nested Python lists and access it elements.
Pandas is an open-source data analysis and data manipulation library written in Python. Pandas provide you with data structures and functions to work on structured data seamlessly. The name Pandas refer to “Panel Data”, which means a structured dataset. Pandas have two main classes to work on, DataFrame and Series.
Data Visualization is the process of presenting data in the form of graphs or charts. It helps to understand large and complex amounts of data very easily. It allows the decision-makers to make decisions very efficiently and also allows them in identifying new trends and patterns very easily. It is also used in high-level data analysis for Machine Learning and Exploratory Data Analysis (EDA). Data visualization can be done with various tools like Tableau, Power BI, Python. Matplotlib is a low-level library of Python which is used for data visualization. It is easy to use and emulates MATLAB like graphs and visualization. This library is built on the top of NumPy arrays and consists of several plots like line chart, bar chart, histogram, etc. It provides a lot of flexibility but at the cost of writing more code.
Contents:
Скачать Data Science: An Emerging Trend in Engineering, Science & Technology
Внимание
Уважаемый посетитель, Вы зашли на сайт как незарегистрированный пользователь.
Мы рекомендуем Вам зарегистрироваться либо войти на сайт под своим именем.
Уважаемый посетитель, Вы зашли на сайт как незарегистрированный пользователь.
Мы рекомендуем Вам зарегистрироваться либо войти на сайт под своим именем.
Информация
Посетители, находящиеся в группе Гости, не могут оставлять комментарии к данной публикации.
Посетители, находящиеся в группе Гости, не могут оставлять комментарии к данной публикации.

