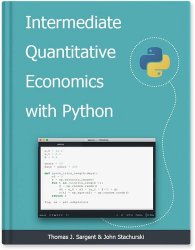
Intermediate Quantitative Economics with Python
- Добавил: literator
- Дата: 2-01-2024, 07:35
- Комментариев: 0
 Название: Intermediate Quantitative Economics with Python
Автор: Thomas J. Sargent, John Stachurski
Издательство: QuantEcon
Год: Dec 21, 2023
Страниц: 1481
Язык: английский
Формат: pdf (true)
Размер: 27.2 MB
This book presents a set of lectures on Python programming for economics and finance.
Substantial parts of Machine Learning and Artificial Intelligence are аbout:
• approximating an unknown function with a known function
• estimating the known function from a set of data on the left- and right-hand variables
This lecture describes the structure of a plain vanilla Artificial Neural Network (ANN) of a type that is widely used to approximate a function f that maps x in a space X into y in a space Y. To introduce elementary concepts, we study an example in which x and y are scalars. We’ll describe the following concepts that are brick and mortar for neural networks:
• a neuron
• an activation function
• a network of neurons
• A neural network as a composition of functions
• back-propagation and its relationship to the chain rule of differential calculus
We describe a “deep” neural network of “width” one. Deep means that the network composes a large number of functions organized into nodes of a graph. Width refers to the number of right hand side variables on the right hand side of the function being approximated. Setting “width” to one means that the network composes just univariate functions.
Linear regression is a standard tool for analyzing the relationship between two or more variables. In this lecture, we’ll use the Python package statsmodels to estimate, interpret, and visualize linear regression models.
Along the way, we’ll discuss a variety of topics, including:
• simple and multivariate linear regression
• visualization
• endogeneity and omitted variable bias
• two-stage least squares
In a previous lecture, we estimated the relationship between dependent and explanatory variables using linear regression. But what if a linear relationship is not an appropriate assumption for our model? One widely used alternative is maximum likelihood estimation, which involves specifying a class of distributions, indexed by unknown parameters, and then using the data to pin down these parameter values. The benefit relative to linear regression is that it allows more flexibility in the probabilistic relationships between variables.
Скачать Intermediate Quantitative Economics with Python
Внимание
Уважаемый посетитель, Вы зашли на сайт как незарегистрированный пользователь.
Мы рекомендуем Вам зарегистрироваться либо войти на сайт под своим именем.
Уважаемый посетитель, Вы зашли на сайт как незарегистрированный пользователь.
Мы рекомендуем Вам зарегистрироваться либо войти на сайт под своим именем.
Информация
Посетители, находящиеся в группе Гости, не могут оставлять комментарии к данной публикации.
Посетители, находящиеся в группе Гости, не могут оставлять комментарии к данной публикации.
