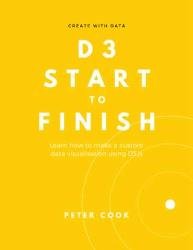
D3 Start to Finish : Learn how to make a custom data visualisation using D3.js
- Добавил: literator
- Дата: 19-02-2023, 05:14
- Комментариев: 0
 Название: D3 Start to Finish : Learn how to make a custom data visualisation using D3.js
Автор: Peter Cook
Издательство: Leanpub
Год: 2022-10-17
Страниц: 260
Язык: английский
Формат: pdf (true), epub
Размер: 10.2 MB
D3 Start to Finish teaches you how to build a custom, interactive and beautiful data visualisation using the jаvascript library D3.js (versions 6 and 7).
The book covers D3 concepts such as selections, joins, requests, scale functions, event handling and transitions. It also covers general web development techniques such as state management and modularisation. In other words, everything you need to know to build a real world, custom data visualisation.
You'll also learn how to put these concepts into practice by building an interactive data visualisation called Energy Explorer. This is a custom data visualisation that visualises the energy mix of 141 countries. There are 15 separate build steps and you're taken through each step in detail. There's also a code download link for all 15 steps so you can follow along.
Some of the topics covered are:
requesting CSV data using D3
D3 data joins (including joining nested data)
architecting a data visualisation using a layout function
detailed styling using CSS
adding a popup using Flourish's popup library
state management
animations using D3 transitions
data manipulation using Lodash
adding a menu, legend and footer
To get the most out of this book you need to be familiar with HTML, SVG, CSS and jаvascript. If you need to get up to speed with these languages I recommend my book Fundamentals of HTML, CSS, SVG & jаvascript for Data Visualisation. I've bundled both books together at a reduced cost (visit bundle).
You’ll also need a text editor (such as VS Code or Brackets), a local web server and a web browser. The book contains two appendices that help you get these set up.
We look at a couple of jаvascript libraries in this book: Flourish’s popup library and Lodash. Flourish’s popup library helps you add an information popup to a web page and Lodash provides functions for processing data (such as sorting and filtering).
To keep things simple build tools such as webpack aren't used. If you'd like to cover ES2015 modules, webpack and other advanced topics have a look at the Advanced Edition package. D3 version 7 is used in this book.
Advanced Edition
The Advanced edition contains additional material including
how to transform the raw data from the World Bank into the required format
how to make Energy Explorer responsive to different device sizes
how to add dark mode to Energy Explorer
ES2015 modules and webpack
how to make Energy Explorer using ES2015 modules and webpack
The Advanced edition is for experienced developers and requires familiarity with Node.js and the command line.
Скачать D3 Start to Finish : Learn how to make a custom data visualisation using D3.js
Внимание
Уважаемый посетитель, Вы зашли на сайт как незарегистрированный пользователь.
Мы рекомендуем Вам зарегистрироваться либо войти на сайт под своим именем.
Уважаемый посетитель, Вы зашли на сайт как незарегистрированный пользователь.
Мы рекомендуем Вам зарегистрироваться либо войти на сайт под своим именем.
Информация
Посетители, находящиеся в группе Гости, не могут оставлять комментарии к данной публикации.
Посетители, находящиеся в группе Гости, не могут оставлять комментарии к данной публикации.
