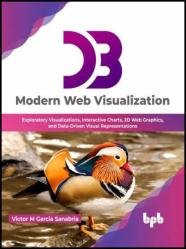
D3 Modern Web Visualization: Exploratory Visualizations, Interactive Charts, 2D Web Graphics
- Добавил: literator
- Дата: 29-11-2022, 02:47
- Комментариев: 0
 Название: D3 Modern Web Visualization: Exploratory Visualizations, Interactive Charts, 2D Web Graphics, and Data-Driven Visual Representations
Автор: Victor M Garcia Sanabria
Издательство: BPB Publications
Год: 2023
Страниц: 345
Язык: английский
Формат: epub
Размер: 10.2 MB
Picking the most appropriate tool is essential whenever you develop a dynamic chart online. D3.js is a clear winner here. The author of this book set out to delve deeply into the software engineering community's most widely used charting library.
From data requests to scale and style, and even some experiment charts, you'll have a firm grasp on everything you need to know to create your charts. You can make static charts much more engaging by incorporating elements such as tooltips, interactions, legends, and selectors.
The book explains how to make a simple chart in easy-to-understand steps. Each chapter in the book will deepen your understanding of the different components of charts and the options that D3.js provides for making them. The book dives deeply into the code and examines various charting examples for different use cases. This book will help you learn to create charts by constantly referencing all chapters.
WHAT YOU WILL LEARN:
-Create 2D illustrations utilizing SVG, Canvas, and HTML5.
-Try out all the different visualization and interaction methods that D3 offers.
-Explore color, contour, noise, and texture.
-Investigate D3's data-driven methods and DOM manipulation capabilities.
-Get access to the full capabilities of modern browsers for producing optimal graphical user interfaces.
WHO THIS BOOK IS FOR:
Even though the book covers the basics of D3.js from the beginning, it is not within the scope of the book to cover jаvascript fundamentals. Unfortunately, we would be diverting from the aim of the book if we had to stop to explain jаvascript and doing no one any favors. We will keep the code simple so that it is easy to follow, but if you get stuck at any point due to basics, please stop to check the part you do not know as well. We are going to be using ES6, D3.js v4, and v5. They are similar enough. We will get into these differences later on. So, it is clear that we are presuming some knowledge of jаvascript in order for you to be able to follow along.
So, who is this book directed at?
• Front-end developers, who need to include charts in their work or even develop new charts that nobody else can make.
• Data Analysts and Data Scientists, who want to write their own charts but do not want to do it in Python because they prefer to have them on Web technology.
• Data Engineers, who want to create their own dashboards.
• Other data people, who just want to get better at visualizations. If that is your case, then presumably, the second half of the book is going to be more interesting. Hopefully, once you are finished, you will have a new appetite for the world of coding.
• Anyone with interest in charts.
• Anyone with interest in data.
• Anyone who loves learning.
Скачать D3 Modern Web Visualization: Exploratory Visualizations, Interactive Charts, 2D Web Graphics
Внимание
Уважаемый посетитель, Вы зашли на сайт как незарегистрированный пользователь.
Мы рекомендуем Вам зарегистрироваться либо войти на сайт под своим именем.
Уважаемый посетитель, Вы зашли на сайт как незарегистрированный пользователь.
Мы рекомендуем Вам зарегистрироваться либо войти на сайт под своим именем.
Информация
Посетители, находящиеся в группе Гости, не могут оставлять комментарии к данной публикации.
Посетители, находящиеся в группе Гости, не могут оставлять комментарии к данной публикации.
