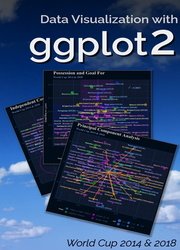
Data Visualization with ggplot2: World Cup 2014 & 2018
- Добавил: literator
- Дата: 25-12-2020, 18:19
- Комментариев: 0
 Название: Data Visualization with ggplot2: World Cup 2014 & 2018
Автор: Naoki Yamaoka
Издательство: Amazon.com Services LLC
Год: 2020
Страниц: 301
Язык: английский
Формат: pdf, epub
Размер: 25.2 MB
This book presents different ways to visualize data in ggplot2. ggplot2 is a R package dedicated to data visualization. It can greatly improve the quality and aesthetics of your graphics, and will make you much more efficient in creating them. ggplot2 allows to build almost any type of chart. The R graph gallery focuses on it so almost every section there starts with ggplot2 examples. There is no theoretical explanation of each analysis method. The analysis uses data for FIFA World Cup 2014 & 2018.
Contents:
Скачать Data Visualization with ggplot2: World Cup 2014 & 2018
Внимание
Уважаемый посетитель, Вы зашли на сайт как незарегистрированный пользователь.
Мы рекомендуем Вам зарегистрироваться либо войти на сайт под своим именем.
Уважаемый посетитель, Вы зашли на сайт как незарегистрированный пользователь.
Мы рекомендуем Вам зарегистрироваться либо войти на сайт под своим именем.
Информация
Посетители, находящиеся в группе Гости, не могут оставлять комментарии к данной публикации.
Посетители, находящиеся в группе Гости, не могут оставлять комментарии к данной публикации.

