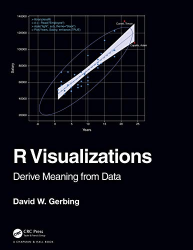
R Visualizations: Derive Meaning from Data
- Добавил: buratino
- Дата: 7-05-2020, 10:50
- Комментариев: 0
 Название: R Visualizations: Derive Meaning from Data
 Автор: David Gerbing
Издательство: Chapman and Hall/CRC
Год: 2020
Формат: True PDF
Страниц: 250
Размер: 14.4 Mb
Язык: English
R Visualizations: Derive Meaning from Data focuses on one of the two major topics of data analytics: data visualization, a.k.a., computer graphics. In the book, major R systems for visualization are discussed, organized by topic and not by system. Anyone doing data analysis will be shown how to use R to generate any of the basic visualizations with the R visualization systems. Further, this book introduces the author’s lessR system, which always can accomplish a visualization with less coding than the use of other systems, sometimes dramatically so, and also provides accompanying statistical analyses.
Key Features
Presents thorough coverage of the leading R visualization system, ggplot2.
Gives specific guidance on using base R graphics to attain visualizations of the same quality as those provided by ggplot2.
Shows how to create a wide range of data visualizations: distributions of categorical and continuous variables, many types of scatterplots including with a third variable, time series, and maps.
Inclusion of the various approaches to R graphics organized by topic instead of by system.
Presents the recent work on interactive visualization in R.
Внимание
Уважаемый посетитель, Вы зашли на сайт как незарегистрированный пользователь.
Мы рекомендуем Вам зарегистрироваться либо войти на сайт под своим именем.
Уважаемый посетитель, Вы зашли на сайт как незарегистрированный пользователь.
Мы рекомендуем Вам зарегистрироваться либо войти на сайт под своим именем.
Информация
Посетители, находящиеся в группе Гости, не могут оставлять комментарии к данной публикации.
Посетители, находящиеся в группе Гости, не могут оставлять комментарии к данной публикации.
