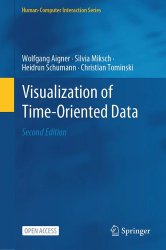
Visualization of Time-Oriented Data (2nd Edition)
- Добавил: literator
- Дата: 26-12-2023, 19:21
- Комментариев: 0
 Название: Visualization of Time-Oriented Data (2nd Edition)
Автор: Wolfgang Aigner, Silvia Miksch, Heidrun Schumann, Christian Tominski
Издательство: Springer
Серия: Human–Computer Interaction Series
Год: 2023
Страниц: 453
Язык: английский
Формат: pdf (true)
Размер: 48.0 MB
Time is an exceptional dimension with high relevance in medicine, engineering, business, science, biography, history, planning, or project management. Understanding time-oriented data via visual representations enables us to learn from the past in order to predict, plan, and build the future.
This second edition builds upon the great success of the first edition. It maintains a brief introduction to visualization and a review of historical time-oriented visual representations. At its core, the book develops a systematic view of the visualization of time-oriented data. Separate chapters discuss interaction techniques and computational methods for supporting the visual data analysis. Many examples and figures illustrate the introduced concepts and techniques.
So, what is new for the second edition? The entire content has been revised and expanded to represent state-of-the-art knowledge. The chapter on interaction support now includes advanced methods for interacting with visual representations of time-oriented data. The second edition also covers the topics of data quality as well as segmentation and labeling. The comprehensive survey of classic and contemporary visualization techniques now provides more than 150 self-contained descriptions accompanied by illustrations and corresponding references. A completely new chapter describes how the structured survey can be used for the guided selection of suitable visualization techniques.
Visualization is a method of computing. It transforms the symbolic into the geometric, enabling researchers to observe their simulations and computations. Visualization offers a method for seeing the unseen. It enriches the process of scientific discovery and fosters profound and unexpected insights.
The goal of this new field of research has been to integrate the outstanding capabilities of human visual perception and the enormous processing power of computers to support users in analyzing, understanding, and communicating their data, models, and concepts.
In recent years, different approaches have been developed to characterize data – the central element of visualization. In their overview article, Wong and Bergeron established the notion of multidimensional multivariate data as multivariate data that are given in a multidimensional domain. This definition leads to a distinction between independent and dependent variables. Independent variables define an n-dimensional domain. In this domain, the values of k dependent variables are measured, simulated, or computed; they define a k-variate dataset. If at least one dimension of the domain is associated with the dimension of time, we call the data time-oriented data.
For the second edition, our TimeViz Browser, the digital pendant to the survey of visualization techniques, received a major upgrade. It includes the same set of techniques as the book, but comes with additional filter and search facilities allowing scientists and practitioners to find exactly the solutions they are interested in.
Скачать Visualization of Time-Oriented Data (2nd Edition)
Внимание
Уважаемый посетитель, Вы зашли на сайт как незарегистрированный пользователь.
Мы рекомендуем Вам зарегистрироваться либо войти на сайт под своим именем.
Уважаемый посетитель, Вы зашли на сайт как незарегистрированный пользователь.
Мы рекомендуем Вам зарегистрироваться либо войти на сайт под своим именем.
Информация
Посетители, находящиеся в группе Гости, не могут оставлять комментарии к данной публикации.
Посетители, находящиеся в группе Гости, не могут оставлять комментарии к данной публикации.
