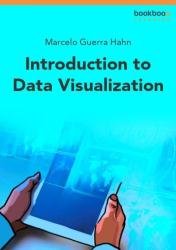
Introduction to Data Visualization
- Добавил: literator
- Дата: 19-01-2023, 04:26
- Комментариев: 0
 Название: Introduction to Data Visualization
Автор: Marcelo Guerra Hahn
Издательство: bookboon.com
Год: 2022
Страниц: 92
Язык: английский
Формат: pdf, mobi, epub
Размер: 10.1 MB
The ability to produce visualizations has become critical, increasingly sought-after. Data visualization simplifies the process of analyzing data by presenting it in a format that's easier for human brains to understand. Since our eyes are more drawn to colors and patterns than words and numbers, this tool helps communicate information much faster and efficiently using graphical representations such as charts, tables, and maps.
For example, an organization can represent its sales data with a map on top of using words and numbers. This visual map, color-coded based on the sales numbers, would help people understand how these sales increase or decrease or how the trend moves over a certain period. Data visualization is a helpful tool for every field in which data plays an important role: industries ranging from marketing to finance to tech. As a result, the ability to produce visualizations has become an important, increasingly sought-after skill for coding in today’s data analysis. This skill has also led to the rise of visualization tools, such as PowerBI, Tableau, and Looker.
This book introduces the basic concepts behind visualizations and provides examples of each in Tableau. Tableau offers step-by-step tutorials on how to create each visualization.
Скачать Introduction to Data Visualization
Внимание
Уважаемый посетитель, Вы зашли на сайт как незарегистрированный пользователь.
Мы рекомендуем Вам зарегистрироваться либо войти на сайт под своим именем.
Уважаемый посетитель, Вы зашли на сайт как незарегистрированный пользователь.
Мы рекомендуем Вам зарегистрироваться либо войти на сайт под своим именем.
Информация
Посетители, находящиеся в группе Гости, не могут оставлять комментарии к данной публикации.
Посетители, находящиеся в группе Гости, не могут оставлять комментарии к данной публикации.
