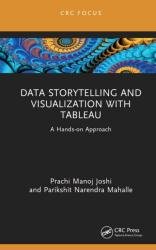
Data Storytelling and Visualization with Tableau: A Hands-on Approach
- Добавил: literator
- Дата: 16-09-2022, 01:16
- Комментариев: 0
 Название: Data Storytelling and Visualization with Tableau: A Hands-on Approach
Автор: Prachi Manoj Joshi, Parikshit Narendra Mahalle
Издательство: CRC Press
Год: 2023
Страниц: 91
Язык: английский
Формат: pdf (true), epub (true)
Размер: 10.6 MB
With the tremendous growth and availability of the data, this book covers understanding the data, while telling a story with visualization including basic concepts about the data, the relationship and the visualizations. All the technical details that include installation and building the different visualizations are explained in a clear and systematic way. Various aspects pertaining to storytelling and visualization are explained in the book through Tableau.
It is believed that picture tells a thousand words. Hence, a visualization will definitely communicate the data more effectively. A good visualization can change the entire perspective. ‘It is not how much you are communicating through a visualization but how you are communicating’. Does the visualization give meaningful insights is the question that should be addressed. Therefore, we need visualization to comprehend the data, to understand it and to interpret it. On the other bright side, a data viz designer will help and assist a data scientist to recognize, identify and know more about the data as well. Still, question arises, why to visualize?
Tableau enables us to come up with a wide range of visualizations to address the needs of the target audience. It is all about delivering good visualizations. A data visualization is a tool that helps us to connect to different data sources and generate visualizations. Csv, Json, spatial, text and many more formats are supported, and with Tableau one can design and develop viz with interactive user interface. Tableau is a smart tool that can in fact recommend which type of viz or chart is best suited for the dataset with the purpose being served.
Tableau deployment comes in different types depending on the functionalities required. The discussion in the book will be based on Tableau Public, a free platform made available to create and share the viz publicly. So, simply put your mail id and install it.
Features
- Provides a hands-on approach in Tableau in a simplified manner with steps
- Discusses the broad background of data and its fundamentals, from the Internet of Everything to analytics
- Emphasizes the use of context in delivering the stories
- Presents case studies with the building of a dashboard
- Presents application areas and case studies with identification of the impactful visualization
This book will be helpful for professionals, graduate students and senior undergraduate students in Manufacturing Engineering, Civil and Mechanical Engineering, Data Analytics and Data Visualization.
Скачать Data Storytelling and Visualization with Tableau: A Hands-on Approach
Внимание
Уважаемый посетитель, Вы зашли на сайт как незарегистрированный пользователь.
Мы рекомендуем Вам зарегистрироваться либо войти на сайт под своим именем.
Уважаемый посетитель, Вы зашли на сайт как незарегистрированный пользователь.
Мы рекомендуем Вам зарегистрироваться либо войти на сайт под своим именем.
Информация
Посетители, находящиеся в группе Гости, не могут оставлять комментарии к данной публикации.
Посетители, находящиеся в группе Гости, не могут оставлять комментарии к данной публикации.
