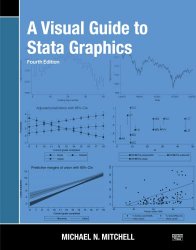
A Visual Guide to Stata Graphics, 4th Edition
- Добавил: TRex
- Дата: 22-01-2022, 12:00
- Комментариев: 0
 Название: A Visual Guide to Stata Graphics, 4th Edition
Автор: Michael N. Mitchell
Издательство: StataCorp LLC
Год: 2022
Формат: ePUB
Страниц: 1023
Размер: 10 Mb
Язык: English
Whether you are new to Stata graphics or a seasoned veteran, A Visual Guide to Stata Graphics, Fourth Edition will teach you how to use Stata to make publication-quality graphs that will stand out and enhance your statistical results. With over 1,200 illustrated examples and quick-reference tabs, this book quickly guides you to the information you need for creating and customizing high-quality graphs for any type of statistical data. Each graph is displayed in full color with simple and clear instructions that illustrate how to create and customize graphs using Stata commands. Stata's powerful graphics system gives you complete control over how the elements of your graph look, from marker symbols to lines, from legends to captions and titles, from axis labels to grid lines, and more. Whether you use this book as a learning tool or a quick reference, you will have the power of Stata graphics at your fingertips.
Внимание
Уважаемый посетитель, Вы зашли на сайт как незарегистрированный пользователь.
Мы рекомендуем Вам зарегистрироваться либо войти на сайт под своим именем.
Уважаемый посетитель, Вы зашли на сайт как незарегистрированный пользователь.
Мы рекомендуем Вам зарегистрироваться либо войти на сайт под своим именем.
Информация
Посетители, находящиеся в группе Гости, не могут оставлять комментарии к данной публикации.
Посетители, находящиеся в группе Гости, не могут оставлять комментарии к данной публикации.
