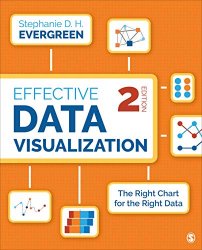
Effective Data Visualization: The Right Chart for the Right Data, 2nd Edition
- Добавил: TRex
- Дата: 30-12-2019, 16:30
- Комментариев: 0

Название: Effective Data Visualization: The Right Chart for the Right Data, 2nd Edition
Автор: Stephanie Evergreen
Издательство: SAGE Publications, Inc
Год: 2019
Формат: AZW3, PDF
Страниц: 352
Размер: 46 Mb
Язык: English
Written by sought-after speaker, designer, and researcher Stephanie D. H. Evergreen, Effective Data Visualization shows readers how to create Excel charts and graphs that best communicate data findings. This comprehensive how-to guide functions as a set of blueprints―supported by research and the author’s extensive experience with clients in industries all over the world―for conveying data in an impactful way. Delivered in Evergreen’s humorous and approachable style, the book covers the spectrum of graph types available beyond the default options, how to determine which one most appropriately fits specific data stories, and easy steps for making the chosen graph in Excel.
New to the Second Edition is a completely re-written chapter on qualitative data; inclusion of 9 new quantitative graph types; new shortcuts in Excel; and entirely new chapter on Sharing Your Data with the World which includes advice on using dashboards; and lots of new examples throughout. The Second Edition is also presented in full color.
Внимание
Уважаемый посетитель, Вы зашли на сайт как незарегистрированный пользователь.
Мы рекомендуем Вам зарегистрироваться либо войти на сайт под своим именем.
Уважаемый посетитель, Вы зашли на сайт как незарегистрированный пользователь.
Мы рекомендуем Вам зарегистрироваться либо войти на сайт под своим именем.
Информация
Посетители, находящиеся в группе Гости, не могут оставлять комментарии к данной публикации.
Посетители, находящиеся в группе Гости, не могут оставлять комментарии к данной публикации.
